Statecharts
drawingTool example
The Statechart design
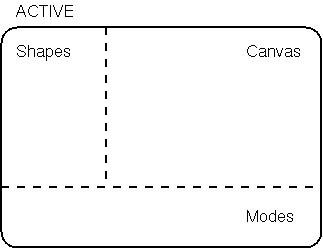
- At the highest level, there are only two states:
ACTIVE and TERMINATED.

- The ACTIVE state is subdivided into three
orthogonal components corresponding to the three
concurrent components of the drawingTool:
Shapes, Modes and Canvas.
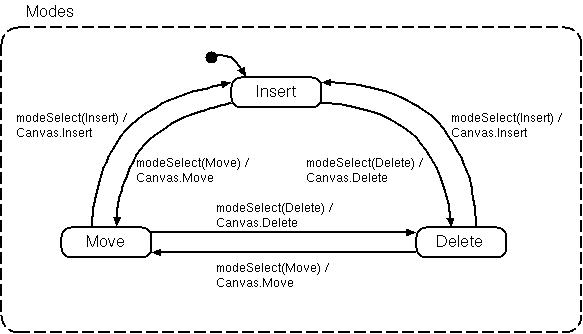
- Selecting a Mode (by clicking on a particular
radioButton in our implementation) broadcasts and appropriate
(Move, Insert, or Delete) event to the Canvas orthogonal
component.
- Selecting a Shape (by clicking on a particular
radioButton in our implementation) just changes the state
of the Shapes orthogonal component. A [guard] in the Canvas
orthogonal component will be used to check which state the
Shapes orthogonal component is in.

- The Canvas orthogonal components has three states: Inserting,
Deleting, and Moving. Transitions between these are triggered
by events broadcast from the Modes orthognal component.
When in the Inserting state, a Mouse1Press (parametrized
with the clicking (x,y) coordinates) will check what
state the Shapes orthogonal component is in. Based on that information,
the appropriate shape is drawn on the canvas at position (x,y).
When in the Deleting state, a Mouse1Press leads to the
deletion of the nearest object on the canvas (if any).
When in the Moving state, a Mouse1Press brings us into
a Moving sub-state. The movingObject variable is set to
remember the object-to-be moved.
Subsequent Mouse1Motion events lead
to moving the movingObject. A Mouse1Release event brings
us back to an idle state (and Mouse1Motion events have again
no special meaning).

The implementation
Though behaviourally equivalent, the implementation
does not literally reflect the Statechart structure:
-
The Tkinter Radiobutton widget allows us to specify
a variable (shapeSelected and modeSelected respectively)
which will be automatically updated when the user clicks on
a different radiobutton. This is is an implementation of
the behaviour we specified explicitly in the Shapes and Modes
parts of the Statechart design.
-
For efficiency reasons, the Canvas part of the design
is implemented by means of if/elif/else constructs.
Inspection shows us that these encode the behaviour
specified in the Statechart.
The drawingTool in action
