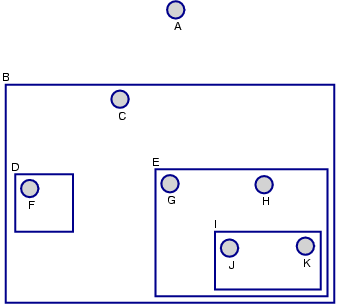
States in DCharts are shown as circles or round-corner boxes. If a state is drawn as a circle, it is a leaf state, which means it cannot contain any substate. When a state is drawn as a round-corner box, it is a composite state. A composite state must have at least one substate in it. Those substates can be composite states or leaf states. The set of composite states and leaf states, and the parent-children relations among them defined in a DCharts model, are called the state hierarchy of the model. As an example, Figure 4.1 shows the state hierarchy of an imaginary model: the model has states A, B, ..., K; B is a composite state with children C, D and E; composite state D has a child F; and so on. The name of a leaf state is shown inside the circle. The name of a composite state is shown in a rectangle above or inside the round-corner box.
Specific modeling tools may depict the state hierarchy in slightly
different ways. In this particular DCharts meta-model in AToM![]() ,
composite states are drawn as blue rectangles. The names are in black,
shown beside the states.
,
composite states are drawn as blue rectangles. The names are in black,
shown beside the states.