|
This report describes the results of my COMP-400 technical project under the supervision of Prof. Hans Vangheluwe during the Fall term 2002.
To built this software, I used a prototyping approach. The first prototype integrated the functionnalities that represented the highest risk. The subsequent prototypes added more features to this one, in decreasing order of risk.
The first aim of this project was to replace the current icon editor of the modelling environment AToM3. This had to be done in a scientific manner so that it could be modified easily later on, as needs increase. This goal was achieved by first designing the drawing tool and its interface and then implementing it. Using this approach gives us the assurance that, in the futur, the new icon editor and its interface could be updated without too much effort.
The design of this software was done via statecharts wich is a formalism for reactive systems that will be discussed in section 3.2. The implementation was done in Python and Tkinter to be compatible with the existing AToM3.
In the present report, I will first present a brief introduction to the unified modelling language (UML) since it was used to built the structure of the software. I will then present a description of the syntax and semantics of statecharts, used to describe the behaviour of our system. I will also explain some of the reasons why the formalism of statecharts was used for this project. I will then present the requirements for the whole software and the "global" design that applies for it. Afterwards, I will present every prototype that has been built, with its requirements and its design. The conclusion will present the problems encountered during this project and the futur work that could be done related to this project.
I have used two different formalisms to describe this software. The first one is the unified modelling language (UML) which describes the static properties of the software. The behaviour of the system was described using statecharts.
The formalismtatecharts was chosen to describe the behaviour of the system because it is a formalism that is compact, easy to understand, and has a big expresiveness power. Since it is event driven, this formalism is appropriate to describe a graphical user interface.
Python is an interpreted, high level programming language. Its ëxecutable pseudocode" syntax is ideal for scripting and for prototyping applications. References on python can be found at or through: www.python.org, together with the interpreter and the standart librairies.
T kinter consist in a number of modules that allow to easily develop graphical user interfaces using python. It has predefined methods for building menus, buttons, etc. It also makes it easy for the user to bind events and methods. Throughout the present report, some references will be made to Tkinter methods or to methods I have bind to an event, especially in the description of the design. Therefore, I will describe some of the characteristics of Tkinter.
In TkInter, most objects are called "widget". For example, there
is a "menu widget" that is used to built menus, there is a
"button widget" for adding buttons to a graphical user interface, etc.
One widget that was particullarly usefull in my case was the
"canvas widget". It provides a structured graphic facility for Tkinter.
It was used as the base of the graphic editor.
On this canvas widget, many items can be added such as arcs, lines,
rectangles, etc. For each item, we can call the corresponding
"create-itemName(coords)" method
to add the item onto the canvas at the
coordinates given by "coords". Once an item is added to the canvas,
its properties can be modified with the "canvas.itemconfig(item, options)"
method.
In order to trigger something, an event must be binded to a method call. For example, in Tkinter, the event of pressing the left button of the mouse is called "B1-press". I have binded this event to the method önDrawingMouse1Press(x,y)" where x and y are the coordinates where the event happened. Similarly, other methods were create to react to other events. A detailed list is given in the appendix (see section 9).
Some events were also bind to update a variable. For example, if the user chooses "property edit" from the öbject" menu, the variable öperationSelected" gets updated to "propertyEdit". This is used as a syntactic sugar to make the statechart more readable and more understandable. In the design of this software, only 2 variables were used, namely öperationSelected" and ßhapeSelected". The ßhapeSelected" variable gets updated when the user clics on one of the buttons on the left, each representing a different shape that could be inserted (see figure 3)
The requirements were divided into 3 categories: requirements regarding shapes, actions and visual aspect. I first made a list of every functionnality of every type that was currently available on AToM3. Whith this list in hands, I asked every member of the Modelling, Simulation and Design Lab (MSDL) their requests regarding the requirements. To each requirement, I assigned a priority and a risk rating, from 1 to 5, 1 being the lowest priority, (and lowest risk) and 5 beign the highest priority (and highest risk). Summing these two rankings gave me an ordering for the implementation of the functionalities. A functionality ranking 10 (highest priority and highest risk) would need to be done first. I have included the table that was built and all the rankings (see table 1).
| Requirement | Priority ranking | Risk ranking | Overall ranking |
| Requirements regarding shapes | |||
| Ovals | 5 | 3 | 8 |
| Line (simple and polylines) | 5 | 3 | 8 |
| Text | 5 | 3 | 8 |
| Free hand form | 1 | 5 | 6 |
| Images (load from existing file) | 3 | 3 | 6 |
| Scripted figures | 1 | 5 | 6 |
| Bar of often used figures | 1 | 5 | 6 |
| Group figures | 4 | 3 | 7 |
| Requirements regarding actions | |||
| Insert figure | 5 | 3 | 8 |
| Select | 4 | 2 | 6 |
| Cut | 4 | 2 | 6 |
| Copy | 4 | 2 | 6 |
| Paste | 4 | 2 | 6 |
| Undo | 4 | 3 | 7 |
| Redo | 4 | 3 | 7 |
| Group | 4 | 4 | 7 |
| Ungroup | 4 | 3 | 7 |
| Lock | 2 | 3 | 5 |
| Rotate | 4 | 2 | 6 |
| Scale | 4 | 2 | 6 |
| Move | 4 | 2 | 6 |
| Change stack height | 5 | 2 | 7 |
| Property edit | 5 | 2 | 7 |
| Open drawing | 5 | 3 | 8 |
| Save drawing | 5 | 3 | 8 |
| Print drawing | 5 | 3 | 8 |
| Close drawing | 5 | 3 | 8 |
| Requirements regarding visual aspect | |||
| Zoom | 1 | 4 | 5 |
| Snap to grid | 1 | 4 | 5 |
| Rulers | 1 | 4 | 5 |
| Layers | 1 | 4 | 5 |
These rankings determined what would be the functionnalities each
prototype would implement. These rankings were used together with
some common sense: if functionnality A depended on functionnality
B, I obviously had to implement functionnality B first. I have
decided to built 6 different prototypes, each one including the
functionnalities of the previous one. The first calendar of
prototypes came out as follows (this was a theoretical calendar
and was subject to change). As you can see, some items of the
original requirements were removed because of time and difficulty
constraints.
Prototype 1
Insert rectangles of any size
Insert ovals of any size
Insert lines and polylines
Insert and edit text
Undo, redo
Open, save, print, close
The last item needed to be part of every prototype since
they needed to be updated each time we added new functionnalities.
Prototype 2
Insert arcs
Insert polygons
Insert regular polygons
Insert images
Prototype 3
Property edit
Rotation
Selection
Prototype 4
Scaling
Grouping
Ungrouping
Prototype 5
Move
Delete
Copy
Cut
Paste
Change stack height
Prototype 6
Zoom
Snap to grid
Lock
Rulers
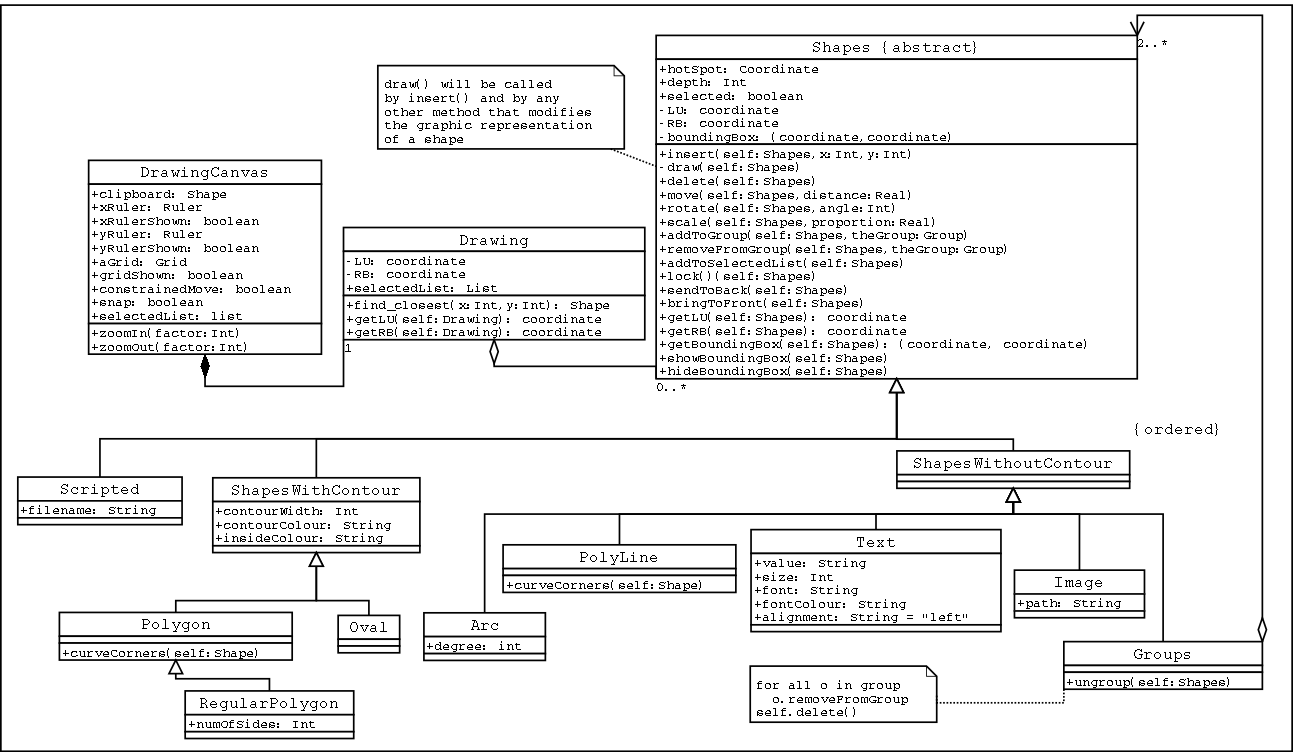
To do the design, I first built a UML class diagram of my software.
This class diagram uses the composite pattern in the formation of
a group object. I had planned to modify it to also include the command
pattern (for implementing undo and redo) but I did not had time to do
so. This class diagram starts
with a DrawingCanvas wich is where we put the drawing. It has
methods and attributes that are related to settings of the
environment and have nothing to do with a particular drawing.
|
A Drawing is drawn on exactly one DrawingCanvas. A drawing contains
any number of shapes. Therefore, the Drawing class contains methods
and attributes related to the bounding box of the union of all those
shapes.
The Shapes class is declared abstract. I have decided
to declare this class abstract in order to make sure that every
object has a certain degree of specialization 1. The Shapes class
contains the methods that apply to any kind of shape. A shape can be
of one of those 3 kinds: scripted, with contour or without contour.
In the ones with a contour, we include polygons and ovals as a
specialization. The shapes without contour can be of type arc,
polyline, text, image or group. A group is made of 2 or more
ordered shapes (composite patern), see [5]. The scripted
figures were not implemented in this project. They would have been
special figures scripted by the user.
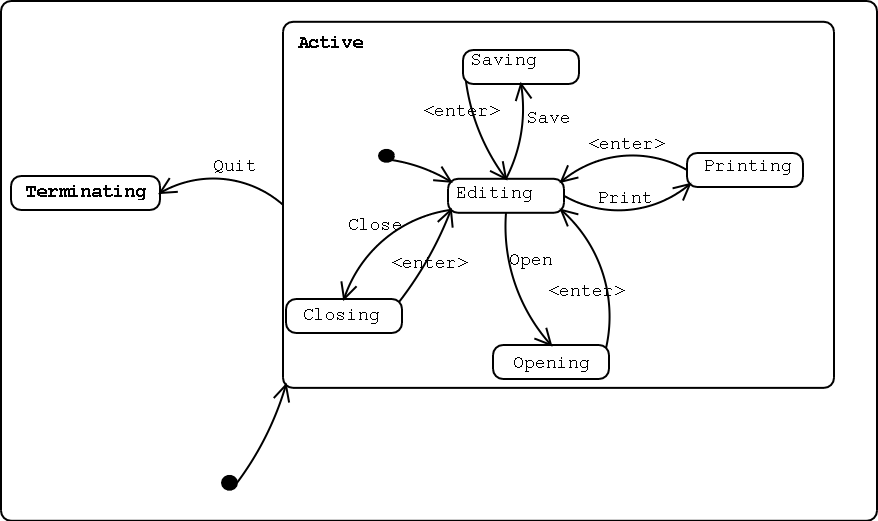
Once the static properties of the software are described, we need
to describe the behaviour of the software. This was done
via statecharts.
|
At the highest level (see figure 2), we can see that, this application can be in either the active or the terminating mode. When we start the application, we are in active mode. In this mode, we start of in the editing state. From this mode, we can go to the Saving, Printing, Opening or Closing state with the appropriate events. From any of those states, we can go to the terminating state with an event Quit that can be generated by closing the window or by choosing "quit" in the menu.
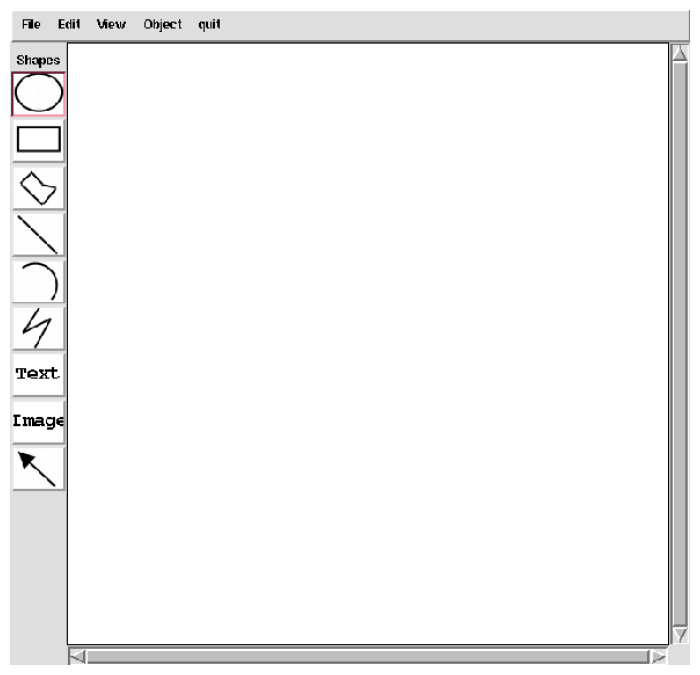
To built this first prototype, I mostly based myself on the previous rankings. Some modifications were made along the way for convience. I also made some modifications due to a change of ranking. Some functionnalities were harder or easier to implement or more or less important than what I had first thought. When I built this first prototype, I made the decision of building an interface that would already be conplete for the other prototypes. This means that in the first prototype, all the options seemed available but only some were implemented using actual code. This interface is presented in figure ~refGUI.
|
This first prototype allowed the user to draw any shape on the canvas, including ovals, rectangles, lines, polygons, polylines and arcs. It also allowed the user to insert plain text (ie only letters and numbers, no editing possible). It didn't allow the user to select a shape and edit it.
|
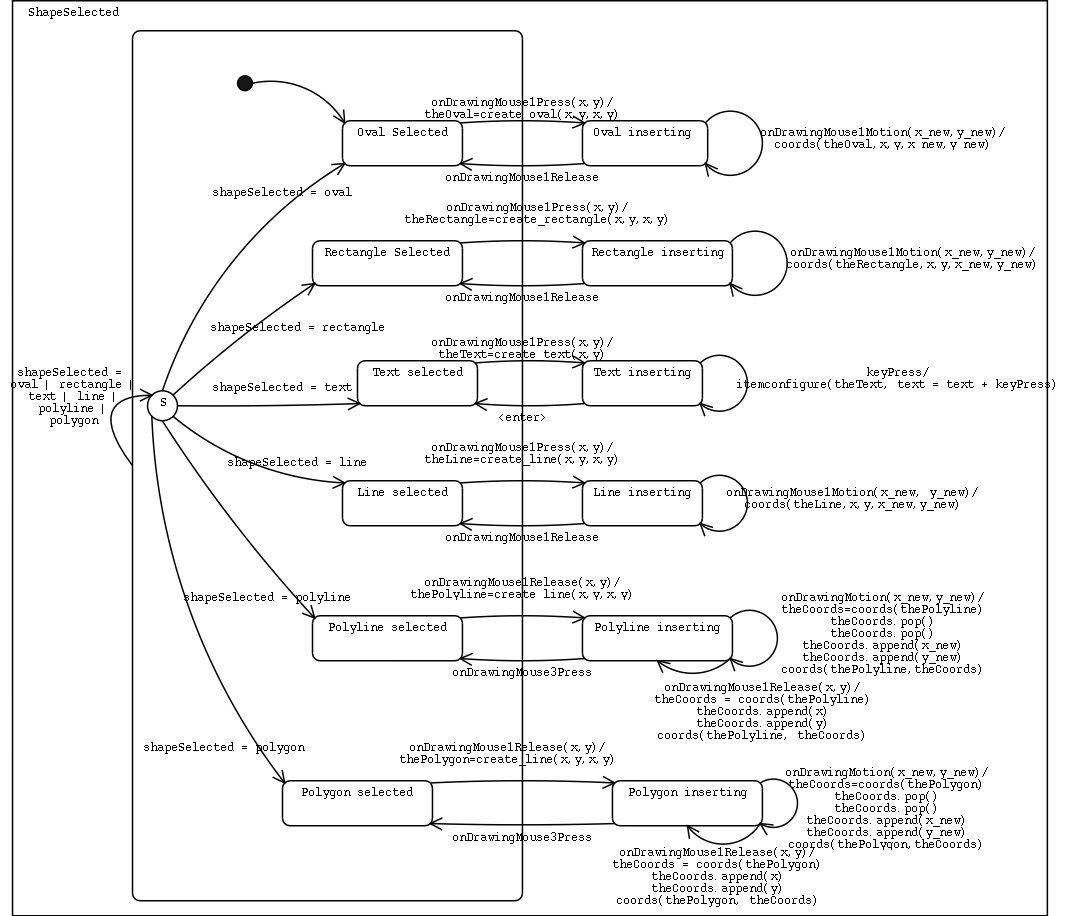
The statechart of prototype 1 (see figure 4) is a zoom in of the editing state. We can see that the initial state we are in when the application starts is öval selected". From this state, we can insert ovals on the canvas by doing a onDrawingMouse1Press on the canvas. In this case, an oval gets created and the system is now in oval inserting mode. While we move the mouse, we stay in this mode and the size of the oval gets changed, according to the moving of the mouse. When we release the button of the mouse (onDrawingMouse1Release), we go back to the oval selected state and the oval has its final size.
From the oval selected state (or from any other state in the shapeSelected state), we can select another shape. A ßelect" pseudo state is used to limit the number of transitions needed to represent this. All the other states in the shapeSelected state behave just like oval selected (ie they react in the same manner to the same events) except for the polyline, the polygon and the text ones.
When in the polyline selected state, a onDrawingMouse1Release event will bring the system in the polyline inserting state and will create a polyline. Every subsequent onDrawingMouse1Release will add a new segment to the existing line. When the third button of the mouse is pressed, (mouse3Press), the system goes back to the polyline selected state and the polyline now has its final size.
The polygon selected state behaves in the same way as the polyline selected one. For every mouse1Release, a new side gets added to the current ones. When the mouse3Press event happens, the polygon gets its final shape and the system goes back in polygon selected state.
The text selected state behaves a bit differently. When in the text selected state and a mouse1Press event happens, a piece of text gets created and the system goes to text inserting mode. Then, every keyPress will be added to the current text written. When the enter key is pressed, the system goes back to the text selected state.
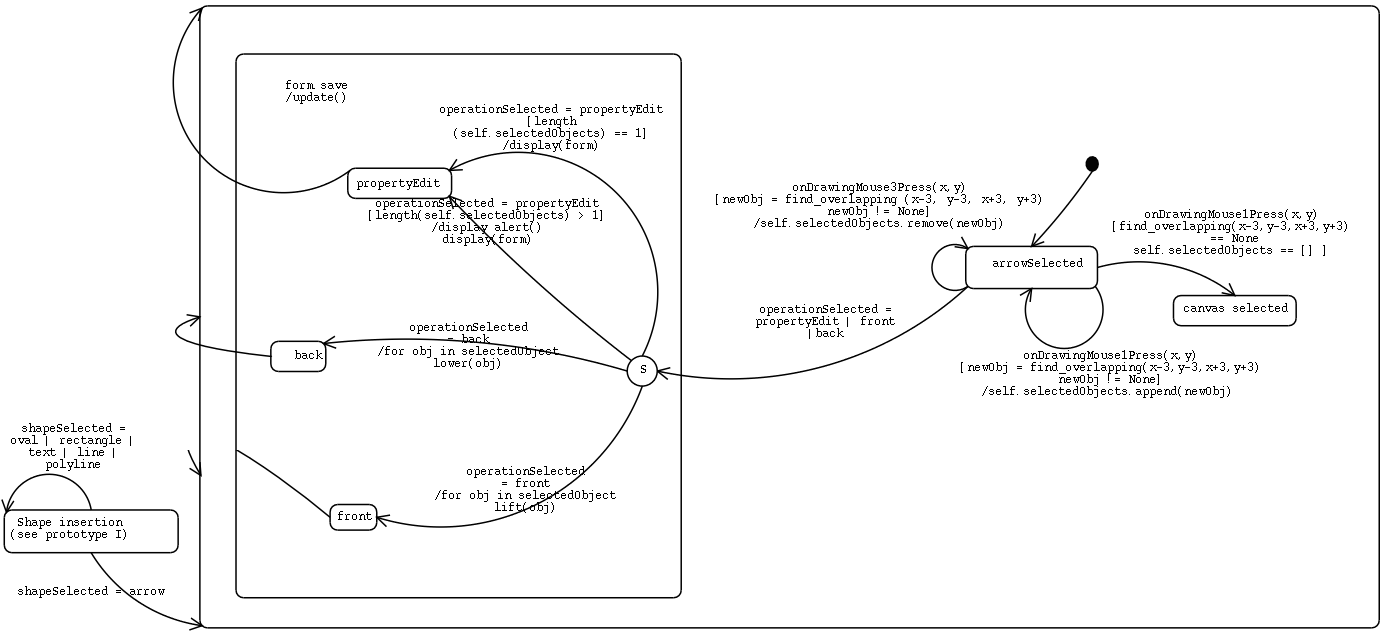
The second prototype added roughly eight new functionnalities. This prototype gave the user the ability to select a shape that was on the drawing. The user was also able to edit the properties of a selected shape. A selected shape could also be moved to the front or to the back, meaning that it could go above or below any other overlapping shape. The drawing could also be saved, closed and reopened later on. The user also had the possibility of saving the drawing as a ".ps" file to be printed.
|
In the statechart of prototype 2 (see figure 5), we can see that the Shape insertion state is now only represented as a "black" box. From this state, we can react to the same events as before and also to the event shapeSelected = arrow. This means that the user has clicked on the tool that allows selection of a particular shape on the drawing. The system is now in the ärrowSelected" state. From this state, the system reacts to a onDrawingMouse1Press, a onDrawingMouse3Press or an operation selection.
We can see that the system reacts in 2 different ways to a
onDrawingMouse1Press. If it finds that the mouse press happened close
enough to a shape, then this shape gets hilighted, meaning that
it has been selected, and it is added to the list of selected
objects of the drawing. On the other hand, if the mouse press
happened far enough from every shape, the system goes to a
"canvas selected" state. This state will be used later on
for operations that apply to the whole canvas, not to particular
shapes (for example: zooming in or out, showing the grid, etc.).
A Mouse3Press event happening when the state is in the arrowSelected
mode will deselect an object (remove the hilighting and remove the
object from the list of selected objects) if there is one that
is close enough. Otherwise, it will just not react to this event.
Finally, from the arrowSelected state, the system will also
react to an operationSelected event. This operation can
be a "propertyEdit", "front" or "back". The corresponding
operation will be applied and the system will go back to the
arrow selected state.
The third prototype added some functionnalities that were planned and some others that were requested during a presentation of prototype 2 to the other team members. The functionnalities that were planned included rotating, moving, copying, pasting and cutting. The functionnalities that were requested are ßelect all shapes of a certain type" (eg: oval, polygon, line...) and deselect everything on the canvas.
|
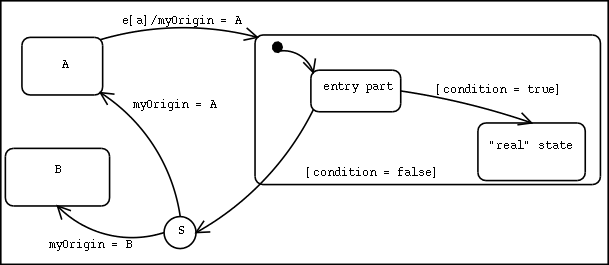
When deciding on a particular formalism to use for the design of our software, we need to take into account the expressiveness power of our formalism, to make sure that we will be able to describe everything we need to. Since some of the design of ATOM3 used Pre/Post conditions, I had to make sure that Statecharts could be used to model any behaviour that can be modeled with Pre/Post conditions. At first glance, it seems that they are not equivalent in expressiveness. Statecharts do not seem to be powerfull enough to express everything that can be expressed with Pre and Post conditions. However, I realized that we could easily make them equivalent by doing the following: (see figure 7)
|
We could consider the pre conditions to be equivalent to guards of a transition in a statecharts. As for the post conditions, they required a bit more work. We would need to save the previous state in a variable, for example "myOrigin", usign parametrized broadcast. Then, in the entry code of the new state, we would need to check that the conditions mentionned in the post condition design are satisfied. If they are, everything is fine and we can continue ie, go to the "real" state, otherwise, we need to go back to the previous state. To do so, we put a transition between the entry state (where the entry code is executed) and a select state. This select state has a transition to every state in the statechart. We can then, usign the variable where we have saved our previous state, restore the state of the system, just like it would be done in a Pre/Post conditions design. If we have used some variables in the entry code, we need to restore them. By doubling every variable (ie varName-current, varName-previous) and saving the old value before assigning the new one, we totally restore the previous state of the system.
The design of a software is a great tool when it comes to actually implementing this software. But, what we think will work perfectly often doesn't turn out to be as good as we thought, because of all kinds of constraints. Always going back to the design to change it before changing the code that is not working properly is a difficult task. It is not something we are used to and it is easy to forget to do it. This leads to a lot of confusion when coming back to the code after a while and realizing that it does not correspond to the design. This problem could be avoid by working in pairs. Both people would participate in the design and in the implementation part of the project but they would be each responsible of one of the two parts. This ensures that the design would always be correctly reflected in the code that is built.
Another difficulty was related to the size of AToM3 and my inexperience of the integration process. This process is rarely considered when building a software. From what I have experience, I believe that it should be taken more into account. I would probably have built my software differently if I had considered what it had to be integrated with at the beginning. I therefore think that integration requirements analysis should be done before any design is done.
My expectations when I first started working on this project were really big. Because of the limited time I had to bring this project to an end, I had to stop at the third prototype. Many of the functionnalities we wanted are still not available. Therefore, a future project could be of extending my work to make sure that all the functionnalities are fully implemented.
I learned a lot by doing this project. Doing the design of
a software is much harder than I thought. It involves a lot of
reflection and must be done perfectly in order to work.
However, once we have this design, it is much easier to build
the code to implement it. I now truly believe that design is
a crucial part of the software building process and that
it should be done before any coding.
I would also like to thanks Prof. Hans Vangheluwe for giving
me this opportunity to work on a large project. It has
helped me organize my thoughts when faced with a new
problem. It also gave me the experience of
working in a research lab. I would like to thank all my
collegues for their support.
Here is a list of the methods I used to bind events.
| Method used | Events it reacts to |
| onDrawingKeyPress | a key from the keyboard was pressed |
| onDrawingMouse1Motion | moving the mouse while the left button is pressed |
| onDrawingMouse1Press | left button of the mouse if pressed |
| onDrawingMouse1Release | left button of the mouse is released |
| onDrawingMouse3Presse | right button of the mouse is pressed |
| onDrawingMotion | moving the mouse with no button pressed |
1It does not
make sense to implement an object of class Shapes since the union
of the subclasses of Shapes completely describes the superclass